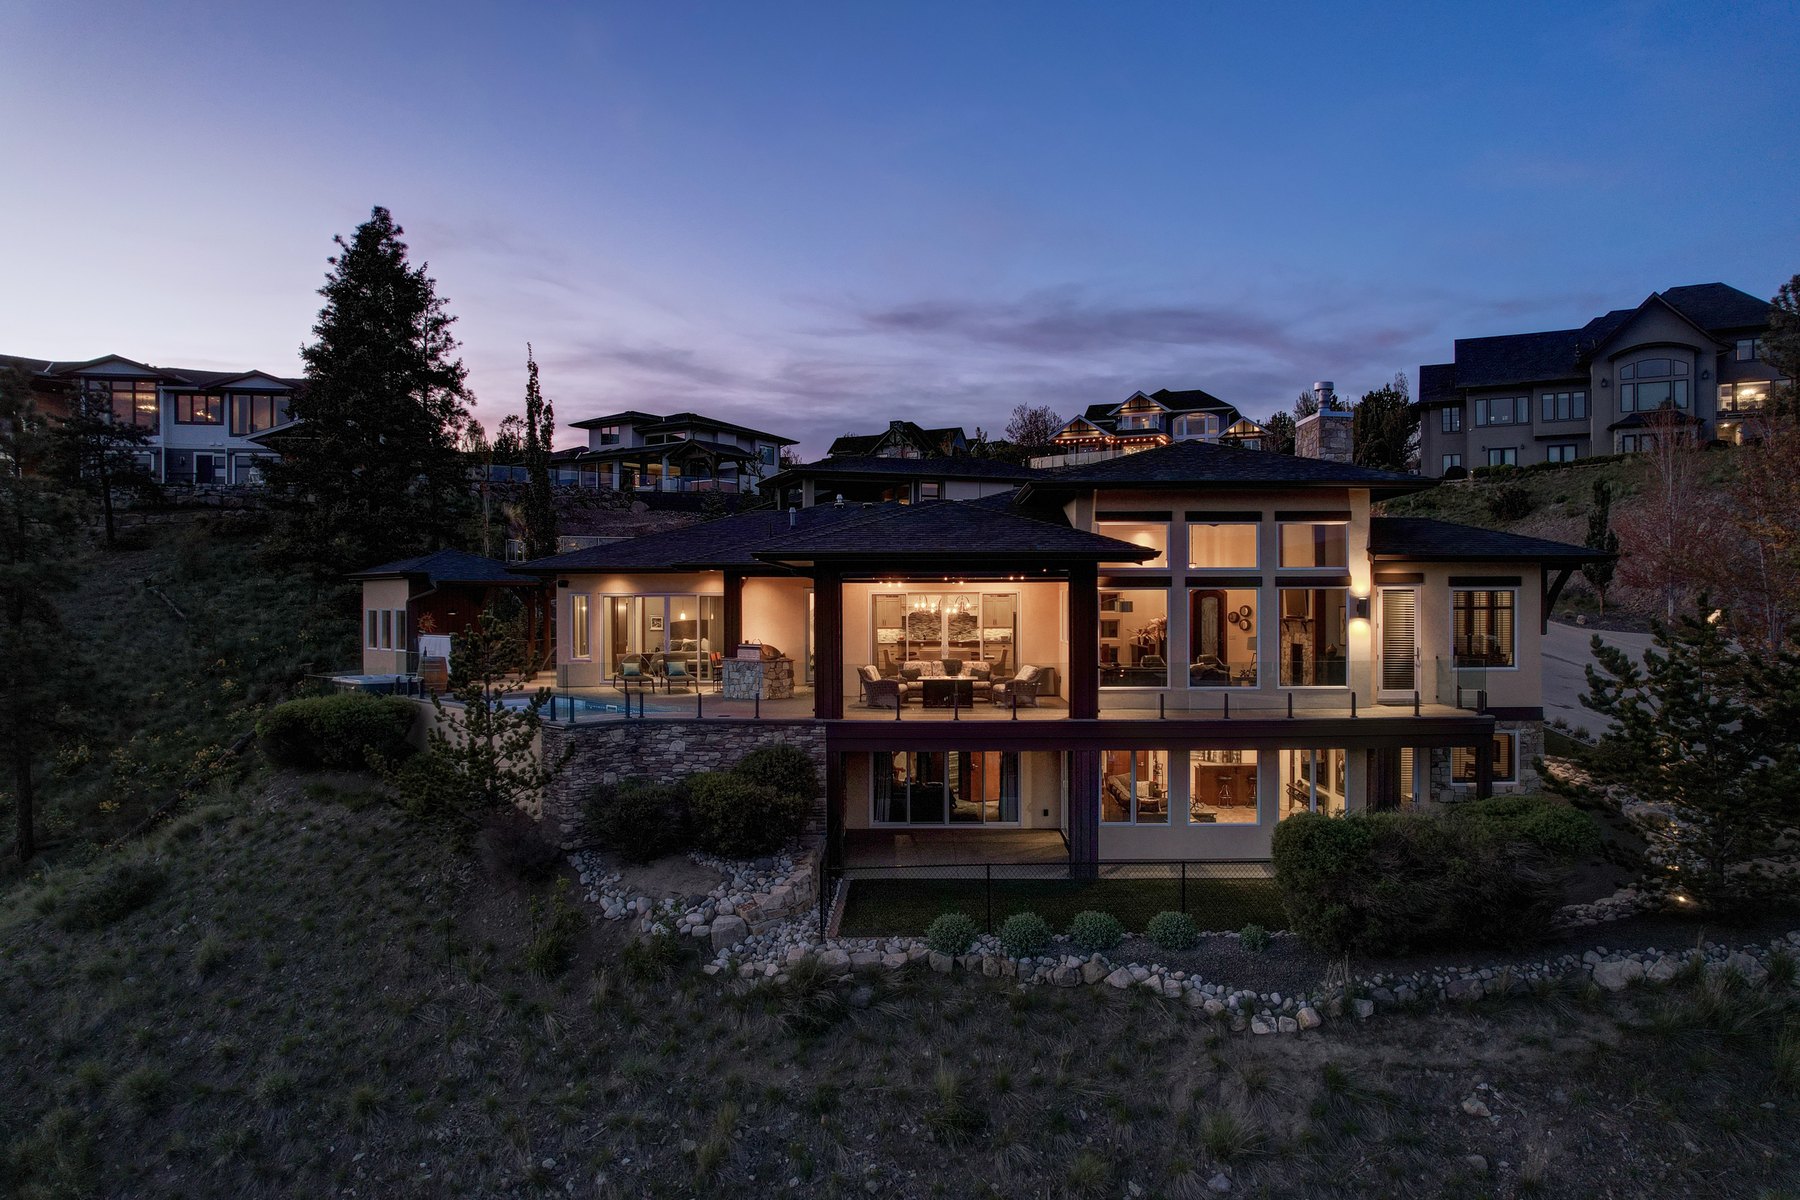
New Build vs Established in Upper Mission: The Real Premium
Braden Koop Personal Real Estate Corporation · Koop Homes Group · REALTOR® · REMAX KelownaEach office independently owned and operated
A newer Upper Mission home — built 2015 or later — sold at a median of $1,605,000 in the first half of 2026. One built in 2004 or earlier sold at $1,334,975. That is a 20% premium for newer construction, and it is the narrowest that gap has been in five years.
Buyers ask me constantly whether a new build is “worth it” in this neighbourhood. Here is what the transactions say, and, more importantly, what the number does and does not prove.
Five years of the new-build premium
| Year | Built 2015+ | Built pre-2005 | Premium |
|---|---|---|---|
| 2022 | $2,258,500 | $1,274,750 | +77% |
| 2023 | $1,565,000 | $1,192,000 | +31% |
| 2024 | $2,119,500 | $1,173,000 | +81% |
| 2025 | $1,730,125 | $1,146,750 | +51% |
| 2026 (Jan–Jun) | $1,605,000 | $1,334,975 | +20% |
This premium is not purely an age premium, and you should not treat it as one. Newer homes in Upper Mission are also, on average, larger, higher up the hill with better views, and on differently shaped lots than the 1990s stock. The gap between these two columns bundles all of that together. What the table genuinely shows is what the two cohorts traded for — not what you would pay to make a 1998 house feel like a 2019 one.
The gap narrowed sharply this year
The interesting movement is not the premium’s existence but its size. It ran between 31% and 81% from 2022 to 2025 and sits at 20% so far in 2026 — and the reason is that the older cohort went up, from a median of $1.15M in 2025 to $1.33M this year, while the newer cohort came down from $1.73M to $1.61M.
With five to six months of data on each side, I would not lean hard on that as a trend. But it is consistent with something I see in practice: buyers who were paying almost anything for new construction in 2022–24 have become more willing to buy an established home and update it, and the price gap has compressed accordingly.
The gap closed from both directions
The premium did not narrow because buyers lost interest in new construction. It narrowed because both cohorts moved toward each other, and that distinction changes what it means.
| Cohort | 2025 median | 2026 median | Change |
|---|---|---|---|
| Built 2015 or later | $1,730,125 | $1,605,000 | −7% |
| Built 2004 or earlier | $1,146,750 | $1,334,975 | +16% |
Older stock rose 16% while newer stock fell 7%. If only the new-build column had moved you could call it a cooling premium; if only the older column had moved you could call it a renovation trend. Both moving toward each other is the signature of buyers reassessing what the difference is actually worth — paying less for turnkey, more for a house they can improve.
One year, and small cohorts. The newer-build sample is 242 listings across four and a half years and the 2026 column rests on five months. I would not extrapolate this into next year. What it does support is the narrower claim: the gap closed from both sides at once, not because one side collapsed.
What you actually get for the premium
At a 20% gap, the newer home costs roughly $270,000 more at the median. Set against that:
Deferred maintenance you are not inheriting. A home built in 2000 is now due, or overdue, for roof, windows, hot water tank and often furnace and deck. Those are real six-figure sums on a house of this size, and they arrive on their own schedule rather than yours.
Building standards. Insulation, glazing and mechanical systems in a 2019 build are meaningfully better than a 1999 one, which shows up in comfort and running costs.
Against that: land and location. The older parts of Upper Mission are often on larger, flatter, more mature lots, closer to the amenities that existed when they were built. A 2019 home further up the hill has the view and the finishings but a longer drive and, frequently, a steeper lot.
How I would decide
The honest framing is not “new versus old” but “pay now or pay later”. If you buy the established home at $1.33M and it needs $150,000 of work over five years, you have effectively paid $1.48M — still under the newer median, and you chose the finishes. If it needs $400,000, you have overpaid for the privilege of managing a renovation.
Which of those you are looking at is a question about the specific house, not about the neighbourhood median. It is decided by the inspection, the age of the mechanical systems, and whether the previous owner maintained the place — and that is exactly the sort of thing worth being unsentimental about before you write an offer.
The short version
Newer Upper Mission homes trade about 20% above pre-2005 stock in 2026, down from 51% last year. The premium bundles age, size, view and lot together, so treat it as what the two cohorts sold for rather than as the price of newness.
For most buyers the real question is what the older house needs and when. Get the numbers on that first; the premium only makes sense relative to a real renovation estimate.
The numbers behind this
Interior REALTORS® Matrix, Residential, Single Family – Detached, Central Okanagan, Upper Mission sub-area, split by year built (2015 and later; 2004 and earlier), January 2022 – June 2026. Pulled 29 July 2026. Aggregate market statistics only. Homes built between 2005 and 2014 are deliberately excluded from both cohorts so the comparison is between clearly distinct groups.
Current new-build activity is on the new construction page, neighbourhood context on Upper Mission homes for sale, and the wider figures in the market report.
Weighing a specific pair?
If you are choosing between a newer build and an established home you would renovate, send me both. I will give you the realistic renovation cost alongside the price gap so you are comparing like with like.
The figures here were put together by Braden Koop Personal Real Estate Corporation from the Association of Interior REALTORS® MLS® System and were current when it was published in August 2026. NOTE: this representation is based in whole or in part on data generated by the Association of Interior REALTORS®, which assume no responsibility for its accuracy. The analysis is mine. I believe the data to be reliable, but it is not guaranteed, and later reporting can change a figure. Treat it as a read on the market, not as advice about a particular home.