What Your Budget Buys in Upper Mission Right Now
Braden Koop Personal Real Estate Corporation · Koop Homes Group · REALTOR® · REMAX KelownaEach office independently owned and operated
As of September 16, 2026, there are 66 detached homes for sale in Upper Mission, and only one of them is asking less than $900,000. Between $900,000 and $2.5 million, a bigger budget mostly buys a bigger house. The price per square foot barely moves until you cross $2.5 million.
Most buyers I talk to start with a number and ask what it gets them here. That is the right question, and the listing count answers it better than any average does. So I pulled every active detached listing in the Upper Mission sub-area from the Interior REALTORS® Matrix system and sorted them by asking price.
What is for sale, by budget
| Budget | Homes listed | Median size |
|---|---|---|
| Under $900K | 1 | not shown |
| $900K to $1.2M | 8 | 2,473 sq ft |
| $1.2M to $1.5M | 16 | 3,084 sq ft |
| $1.5M to $2M | 16 | 4,147 sq ft |
| $2M to $2.5M | 13 | 4,648 sq ft |
| $2.5M and up | 12 | 5,286 sq ft |
The practical entry point to a detached home in Upper Mission is now $900,000, and even that band is thin: eight listings. Sixteen sit between $1.2 million and $1.5 million, and another sixteen between $1.5 million and $2 million. That is where the choice is.
Twenty-five of the 66 are asking $2 million or more. That is more than a third of everything on the market.
Size climbs steadily with price. The typical listing under $1.2 million has about 2,500 finished square feet and three or four bedrooms. Between $1.5 million and $2 million it is over 4,100 square feet with five. Age moves less than you might expect: the median build year runs from the early 2000s at the bottom of the range to 2016 in the $2 million to $2.5 million band, which is where most of the newer homes are priced.
Price per square foot barely moves until $2.5 million
| Budget | Asking per sq ft | Median days listed |
|---|---|---|
| $900K to $1.2M | $408 | 45 |
| $1.2M to $1.5M | $443 | 21 |
| $1.5M to $2M | $431 | 58 |
| $2M to $2.5M | $465 | 78 |
| $2.5M and up | $581 | 86 |
This is the number I find most useful. From $900,000 to $2.5 million, the median asking price per square foot stays between $408 and $465. Spending an extra million dollars inside that range does not buy a more expensive kind of house per foot. It buys more of the same kind.
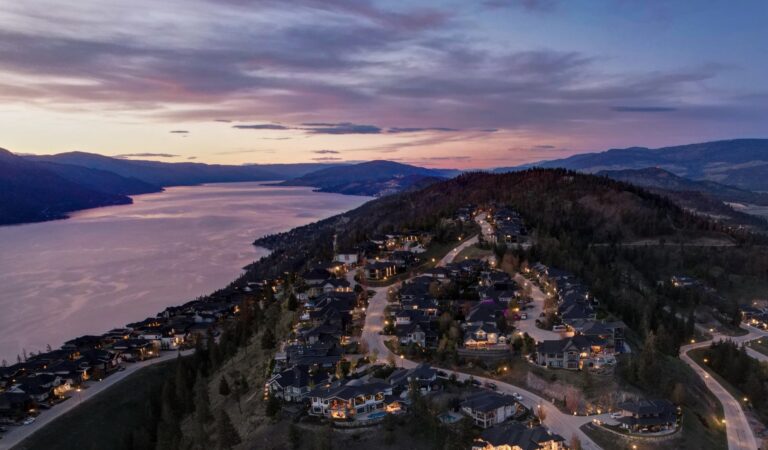
Above $2.5 million it jumps to $581. That band includes waterfront on Lakeshore Road, which the board counts as part of Upper Mission, and it suggests that location, view and lot are carrying more of the price up there than floor area is.
How long current listings have been sitting
The last column is how many days the homes in each band have been on the market so far. It is not how long homes take to sell, because none of these have sold yet. What it does show is where listings are turning over and where they are waiting.
The $1.2 million to $1.5 million band has a median of 21 days, so most of what you see there is recent. From $2 million up, the median is 78 to 86 days. A lot of those homes have been waiting for a buyer for close to three months.
How to read this. These are asking prices, not sale prices, and a median of 16 listings moves when a few homes list or sell. The board’s Upper Mission sub-area is a little wider than the neighbourhood most people picture. Treat the bands as a snapshot of September 2026, not a forecast.
What I would do with this
If your budget is $1.2 million to $1.5 million: you are shopping in the busiest part of this market. Be pre-approved before you start, and see new listings in the first week, because the good ones in this band are not sitting.
If you are at $2 million or more: you have more homes to choose from, and more of them have been listed for a while. In my experience a house that has sat for 80 days is a different negotiation than one that listed last week, but it depends entirely on the house and why it has sat.
The listings themselves change every day. To see what is available in your band right now, start with the current Upper Mission homes for sale. For price history across years rather than a single month, the Upper Mission market report has it, and if you are shopping above $2.5 million, the luxury homes page covers that end of the market.
Start with your number
Tell me your budget and what matters most, and I will send you the homes that fit it.
The figures here were put together by Braden Koop Personal Real Estate Corporation from the Association of Interior REALTORS® MLS® System and were current when it was published in September 2026. NOTE: this representation is based in whole or in part on data generated by the Association of Interior REALTORS®, which assume no responsibility for its accuracy. The analysis is mine. I believe the data to be reliable, but it is not guaranteed, and later reporting can change a figure. Treat it as a read on the market, not as advice about a particular home.